|
4 Discussion
4.1 Theoretical framework 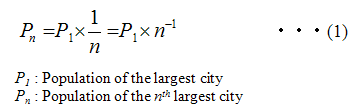
This formula signifies that the second city’s population is the half of the top city’s population, the third city’s population is the 1/3 and likewise afterwards, as in the acoustic harmonic distribution. Graphically speaking, when the city population is plotted logarithmically to its rank, a linear distribution with a negative one (-1) slope is obtained. It has been shown that this rank-size rule applies to various cases of modern cities. 
According to this formula, the nth city population is expressed with the top city population(P1) and the slope of the distribution (-a). For example, using this formula, the slope of the city population distribution in the world in 2000 is -0.5791 and the linearity is as strong as R=-0.9802, it can be said that the generalized rank-size rule applies (Figure 5).  Figure 5 City population rank-size distribution (World : 2000) Note : Urban agglomeration in UN(2004b) is used as city population
Rank-size rule has been used to analyze the city population, i.e. the agglomerations of larger size. Here we will see if this rule also applies to smaller sized cities or even to villages.  Figure 6 Shi-Cho-Son population rank-size distribution (Japan : 2000) Source : Population Census of Japan(2000)
This shows that the Shi-Cho-Son population distribution is continuous throughout the different unit of agglomeration such as the city, town or village, until the community size becomes very small to a population of 5,000. 
From this formula (3), the total population(PT) is expressed using the top city population(P1), the slope of rank-size distribution(-a) and the number of communities(N). When -a and N is stable, the change of PT is reflected to P1 change, which is followed by the lower rank(2nd, 3rd...) cities’ population change. As a result, with the total population change, the rank-size distribution shifts horizontally, which can be illustrated using the data of China (Figure 7). In this case, the change of larger cities’ population is parallel to the change of total population and the city population ratio is stable.  Figure 7 Vertical shift of rank-size distribution according to the total population PT (in 1,000) (China)
However, even before the border year, there was a minor change of city population ratio and this can be attributed to the other parameters; -a and N. From the formula (3), it can be said that the steeper the slope –a and smaller the number of the community N, the smaller the total population (PT) gets and thus larger the city population ratio gets. For example, in China up to 1300, there is a strong correlation (R=-0.9392, Figure 8) between the slope –a and city population ratio. This correlation does not apply for the period from 1400 to 1850 but from a partial evidence of increased number of towns and cities (Liu 1987), the city population ratio might be influenced by the number of communities N in this period.  Figure 8 Correlation of Slope -a and city population ratio (Up to 1300) Note : For the excluded year of 900 and 1000, please refer to the 4th paragraph of section 2.2. Among the 3 factors determining the total population, the P1 might be the most important one but the other two, -a and N are closely related to the social structure and would be useful for the more detailed estimate. However the manner and degree in which these variables affect the city population ratio remains to be investigated in the future.
Previous / Next TOP |
