Population trend in GCC countries
Reiko Hayashi
1. Population outlook
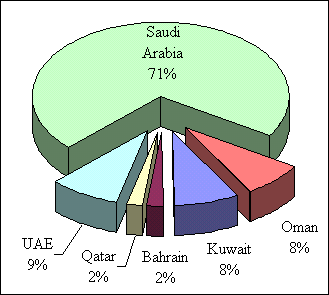
In the year 1998, 1.3 billion people or a fifth of world total 5.9 billion people are Muslim. Among them, 270 million are Arabs, which is here defined as the population of 22 member countries of Arab Leagues. Saudi Arabia, Kuwait, Bahrain, Qatar, United Arab Emirates(UAE) and Oman are the member countries of Gulf Cooperation Council(GCC) countries whose total population counts 28.67 million (UN ESCWA, 1998), which is roughly 10 % of total Arab population.Among these 6 countries, 71% is Saudi Arabia, followed by UAE(9%), Kuwait(8%) and Oman(8%), Bahrain and Qatar remain demographical minority presenting both 2% of total GCC country population.
Figure 1 GCC POPULATION 1998

SOURCE : UN ESCWA
As for other indicators, population density is highest in Bahrain, which has 885.1 person par km2 in contrast with the lowest Oman (7.7 person/km2). GNP par capita varies from Oman (4,940 US$) to Kuwait (20,190 US$) but wealthier than other Arab or Islamic countries in general. Except Oman, GCC countries building was done during the 20th century and can be regarded as a "young country" in terms of "nation-state".
Census is well organized in Kuwait and Bahrain since as early as 40's and 50's and Saudi Arabia, UAE, Qatar followed them. Oman carried out its first census in 1993 and planning the next one in 2003.
Table 1 Basic Indicators
|
Kuwait |
Bahrain |
Qatar |
UAE |
Saudi Arabia |
Oman |
Total |
|
|
Population(a) |
2,265,515 |
625,783 |
546,784 |
2,662,983 |
20,174,045 |
2,397,112 |
28,672,222 |
|
Area km2 |
17,818 |
707 |
11,427 |
83,600 |
2,150,000 |
310,000 |
2,573,552 |
|
Population Density pop/km2) |
127.1 |
8585.1 |
47.9 |
31.9 |
9.4 |
7.7 |
11.1 |
|
GNP par capita (US$) (b) |
20,190 |
8,640 |
11,340 |
18,240 |
7,150 |
4,940 |
|
|
Year of Independence |
1961 |
1971 |
1971 |
1971 |
1932 |
1650 |
|
|
Census Year |
1957,61,65 |
1941,50,59 |
1970,86 |
1968,71,75 |
1962/63,74 |
1993,(2003) |
(a) United Nations Economic and Social Commission for Western Asia, 1998
(b) UNICEF1999
2. Rapid Increase of Population
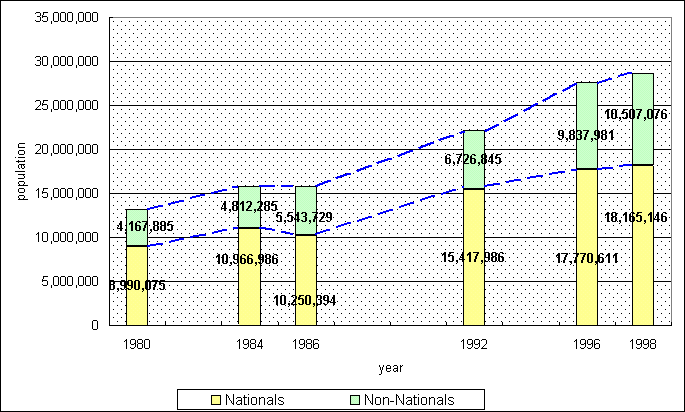
GCC population has increased dramatically since 1980 to 1998, both national and non-national.Figure 2 Population Increase in GCC (1980-1998)
SOURCE : UN ESCWA
This population trend reflects greatly that of Saudi Arabia as it comprises the 71% of GCC population.
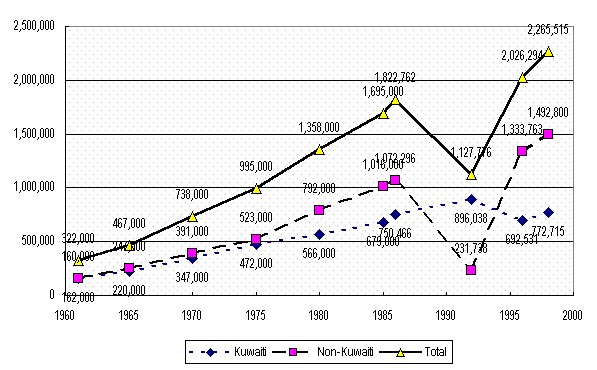
As for Kuwaiti population, as shown in figure 3, Kuwaiti as well as non-Kuwaiti has grown rapidly since the start of the country in the 1960's. Especially from 1975, with the rise of the oil price, the need for labor force has made the dramatic increase of non-Kuwaiti population. Interesting thing although is that even at the point of nation building in 1960, the Kuwaiti and non-Kuwaiti was both around 160,000 people, which shows the nature of the multi-national state of Kuwait. Because of Iraqi invasion in Kuwait in 1990-1991, the population 1992 shows much decrease of non-Kuwaiti, leading the total population lower, but the Kuwaiti population has a slight increase.
Figure 3 Population trend of Kuwait 1961-1998
SOURCE : 1960-1985 -> Kuwait Ministry of Planning, 1986-1998-> UN ESCWA
3. Fertility trend
According to the WHO data (table2), the total fertility rate, which means average number of children in a family in GCC countries has greatly decreased in 20 years from 1978 to 1998. In 1978, this rate is highest in Saudi Arabia (7.3) and lowest in Bahrain (5.2) but anyway much higher than world average (3.9). In 1998, 20 years later, Bahrain and Kuwait have decreased the rate as low as 2.9 close to the world average whereas Saudi Arabia, Oman keep their high level as 5.8 and 5.9 respectively.
Table 2 Total Fertility Rate in GCC countries(1978-1998)
|
Bahrain |
Kuwait |
UAE |
Qatar |
Saudi Arabia |
Oman |
World |
|
|
1978 |
5.2 |
5.9 |
5.7 |
6.1 |
7.3 |
7.2 |
3.9 |
|
1998 |
2.9 |
2.9 |
3.4 |
3.7 |
5.8 |
5.9 |
2.7 |
SOURCE : WHO
These rates are for both nationals and non-nationals. In the beginning, Non-nationals were dominantly Arabs but later the Asian non-nationals such as Indians and Pakistani, Philippines etc. has increased to satisfy the labor demand. These Asians tend to come for a shorter period without family, thus their fertility rate is lower than the Arab non-nationals or nationals.
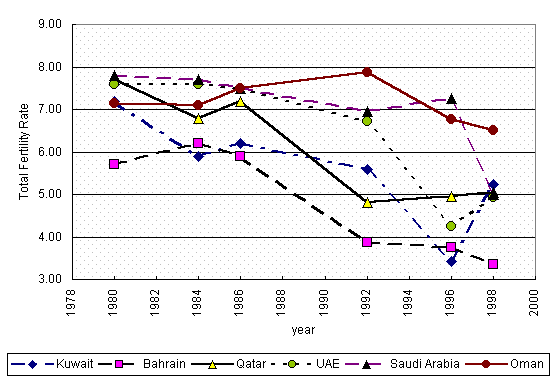
To eliminate the effect of changing nationality of non-nationals, figure 4 shows the trend of total fertility rate for nationals only. Just as well as fertility rate of the whole population, this rate for the nationals only also shows a steady decrease especially in the 80's in Bahrain, Qatar, Kuwait and UAE. A light heap in Qatar, Kuwait, and UAE is observed in 1996 to 1998.
Figure 4 Trend of Total Fertility Rate of Nationals in GCC Countries
SOURCE : UN ESCWA
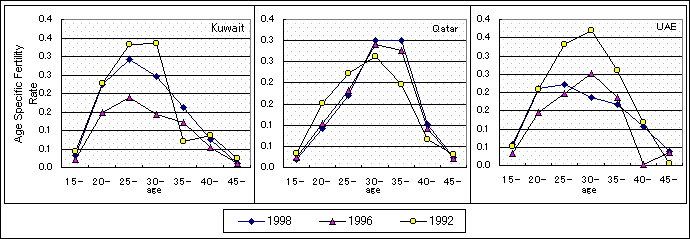
To further observe the slight increase of fertility in 1990's, Figure 5 shows the age-specific fertility rate change in 1992, 1996 and 1998 in Kuwait, Qatar and UAE.
Figure 5 Age-Specific Fertility rate in Kuwait, Qatar and UAE in 1992, 1996,1998
SOURCE : UN ESCWA
The increase of the fertility in Kuwait is due to the increase of the fertility of women of all age, although the Qatar increase is due mainly for the women aged 30 and more, in contrast with UAE where the fertility of the young women (20-25 years) is playing a important role to increase the fertility. If there is a real increase in fertility then it needs more detailed analysis.
4. Life Expectancy Increase and Demographic Transition
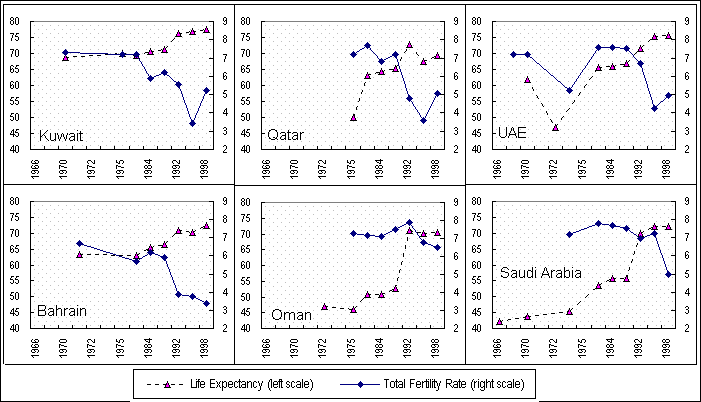
As the medical technology quickly expand throughout the GCC countries, the life expectancy has attained around 70-75 years but its path was a bit different from country to country.
Figure 6 shows the trend of life expectancy and total fertility rate in each country. Life expectancy in Kuwait and Bahrain was already in the level of 60-70 years old in the 1970's, when Saudi Arabia and Oman level was around 40 years old. Qatar and UAE have caught up with Kuwaiti/Bahrain level in the early 1980's, and Oman and Saudi Arabia waits until in the 1990's.
Figure 6 Life Expectancy and Total Fertility Rate in GCC countries
SOURCE : UN ESCWA
In any case, as the increase of life expectancy, that is decline of mortality was followed by the decrease of fertility, the demographic transition is observed in GCC countries. However, the life expectancy is already high level but still it keeps comparatively higher fertility rate (TFR:3-6), it is interesting to see if the fertility rate would be going to decrease like in western countries or to stay as it is, to show a unique characteristic of the population of gulf.
5. High Portion of Non-Nationals
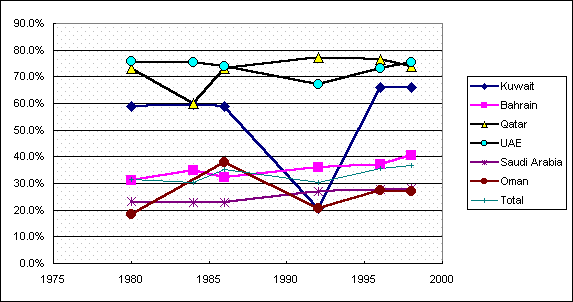
In GCC countries, the non-nationals occupy 37% of total population which is extremely high compared to the other countries. Japanese foreigners are 1.2% of total population, French figure is 6.8%, Germany 7.3%, USA, famous for being the "immigrant's country" has only 0.3% registered foreigners, as it has restricted number of immigrants before granting the green card or nationality.
Non-nationals are especially high in UAE and Qatar around 70%. Qatar recently losing this rate but UAE keep on increasing the foreigners since 1992.
Kuwait has dramatically dropped the number of non-nationals right after the gulf war but since 1996 it starts to increase again until it arrive to the level higher than that before the war.
Oman and Saudi Arabia has comparatively lower level of non-nationals and it stays around 20% in the 1990's. Saudi Arabia has controlled the number of non-nationals as the employment of its own people is a keen issue. However, as the total population of Saudi Arabia is large, 54% of total non-nationals in GCC countries are in Saudi Arabia, keeping this country as a large labor importer.
Figure 7 Proportion of Non-Nationals in GCC countries
SOURCE : UN ESCWA
In the early days, non-nationals in GCC countries were mostly Arabs such as Egyptian, Jordanian, Yemenite, Palestinian. As mentioned before, at the independence, half of Kuwaiti population was non-Kuwaiti. It is well known that in the Arab world, there used to be quite active mobilization of the people over the borders.
However, since the 1970's oil boom, a lot of labor force were required and Arabs only could not afford that. This demand also prompted labor export and broker business
in Asian countries such as Pakistan, India, Sri Lanka, Philippine. As shown in the Table 3, Asiatisation of non-nationals is quite obvious in all GCC countries, with Qatar, Bahrain, UAE and Oman from already 1975, the rest is from 1980.Table 3 Nationality of Non-Nationals in GCC countries
|
Bahrain |
Kuwait |
Oman |
Qatar |
Saudi Arabia |
UAE |
|||||||
|
1975 |
1980 |
1975 |
1980 |
1975 |
1980 |
1975 |
1980 |
1975 |
1980 |
1975 |
1980 |
|
|
Arabs |
21% |
13% |
69% |
64% |
12% |
12% |
28% |
25% |
90% |
80% |
25% |
22% |
|
Asians |
63% |
77% |
30% |
34% |
84% |
83% |
71% |
73% |
6% |
16% |
73% |
75% |
|
Others |
15% |
10% |
1% |
1% |
4% |
4% |
1% |
2% |
3% |
4% |
2% |
3% |
|
Total |
100% |
100% |
100% |
100% |
100% |
100% |
100% |
100% |
100% |
100% |
100% |
100% |
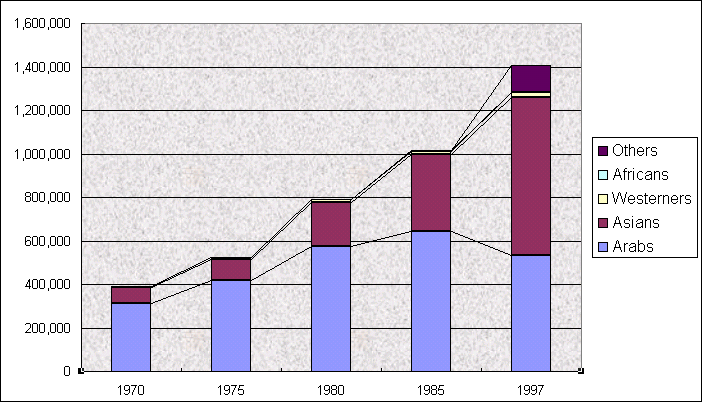
As the data is Kuwait is available, the recent trend in the country is that a sharp increase of Asians are compensating the decrease of Arabs since 1980's. In 1997, total number of non-nationals has increased but Arabs decrease and Asians increase.
Figure 8 Nationality of Non-National in Kuwait
SOURCE : Population Spatial Distribution, UN-ESCWA, November 1993 and Ministry of Planning, Kuwait
GCC countries has its unique style of demography which is worthwhile to analyze. More data should be collected and published to deepen the understanding.
Copyright 1997-2001